The New Tech Networks promotional literature paints an enticing picture of a program that will offer students a new and exciting method of learning that advances their college aspirations. Nothing could be further from the truth.
At the Nov. 13, 2012 meeting, the School Board was presented with college readiness data taken from New Tech Networks (“NTN”) publication, Alumni Perspectives; Exploring the Impact of New Technology High Schools on College and Work Readiness – November 2010. This document is not rigorous peer reviewed research built upon valid sampling and statistical methods. It is marketing fluff derived from an online survey completed by 33 alumni of 8 NewTech High Schools (see page 5 for the study methods). At the January 15, 2013 meeting, the School Board received the complete NTN publication, New Technology High School, Postsecondary Student Success Study. This document is another survey document, this time surveying a group of 244 responding alumni from New Technology High School in Napa, California. Neither document contains any data which is useful for comparing the academic achievement of NTN students and their peers. The results of confusing a self-assessment of knowledge with knowledge are illustrated in Professor Marlene Zuk’s commentary, Right, Wrong … What’s the Dif?
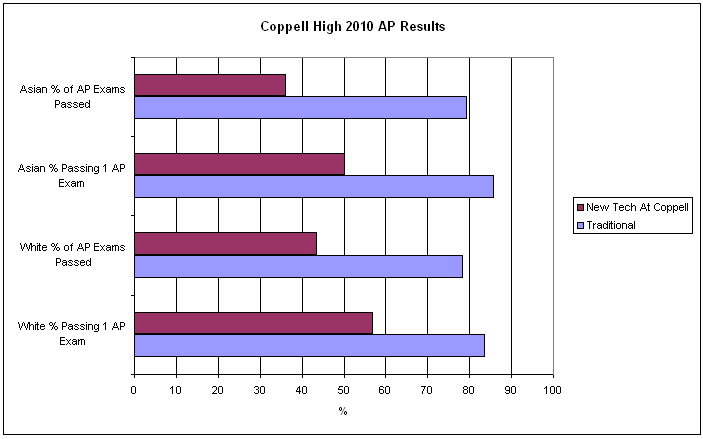
At the Nov. 13, 2012 Board Meeting, NewTech Networks presented Texas accountability data for Coppell High School in Dallas, Texas. The presentation has two parts. One part presents the testing data for Coppell High School. The other part is a narrative about NewTech High at Coppell. This is an artful misdirection. The State of Texas reports the NTN program at Coppell High separately from Coppell High School. Instead of presenting the testing data for the NTN program, the testing data that was presented was for the traditional high school. In Texas, “commended” corresponds to California’s Advanced and Proficient scores. These charts show the relative performance of the NTN program and the traditional program at Coppell High School. The first chart shows the Texas state standardized test results. With the exception of nominal improvement in English Arts scores, the NTN program reduced academic achievement. The second chart shows AP testing results.
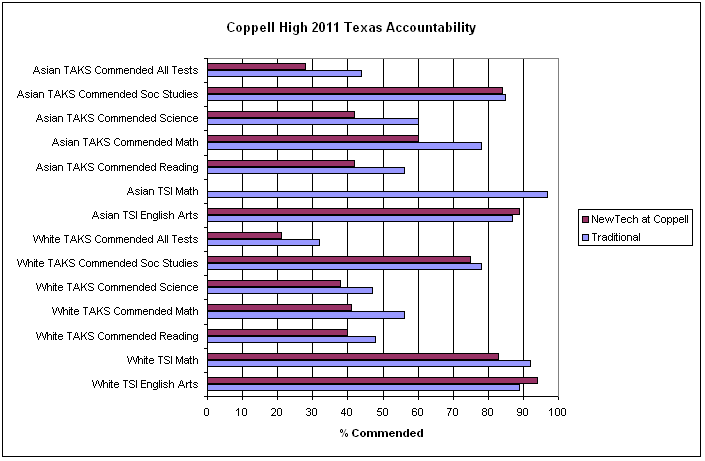
The poor preparation suggested by the standardized testing is confirmed by the AP scores.
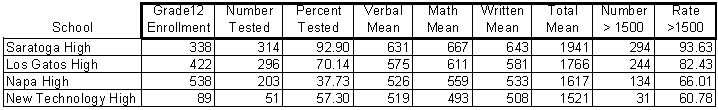
In a similar slight of hand, the Dec. 4, 2012 Board Materials provide dubious comparisons for New Technology High in Napa. Rather than comparing New Technology High at Napa to Napa High or our schools, there are county and national comparisons. For our district’s analysis, it is important to note that unlike Coppell High and Los Gatos High, Napa High is not a high performing high school. This table compares the SAT results at New Technology High at Napa with Napa High and the schools in the LGSUHSD.